Microsoft Excel has been around since 1985, yet it remains one of the most used software tools on the planet. That says a lot. In 2026, with AI tools everywhere and newer platforms like Google Sheets competing for attention, Excel hasn’t just survived — it’s evolved. Whether you’re managing a household budget, running financial models for a Fortune 500 company, or analyzing data as a freelancer, Excel probably belongs in your toolkit.
This post breaks down what Excel actually is, what it can do, and whether it’s still worth your time to learn. Spoiler: it is — but the reasons why might surprise you.
Quick Takeaways:
- Microsoft Excel is the world’s most widely used spreadsheet software, with over 750 million users globally as of 2024.
- Excel handles far more than basic math — it supports data visualization, automation via macros, and now AI-powered features through Microsoft Copilot.
- Learning Excel increases your earning potential. Roles requiring Excel skills pay an average of 12% more than comparable positions without that requirement.
- Excel isn’t just for finance teams. Teachers, marketers, project managers, and small business owners use it daily.
- Free alternatives exist, but Excel’s depth, integration with Microsoft 365, and enterprise reliability keep it the industry standard.
What Is Microsoft Excel, Exactly?
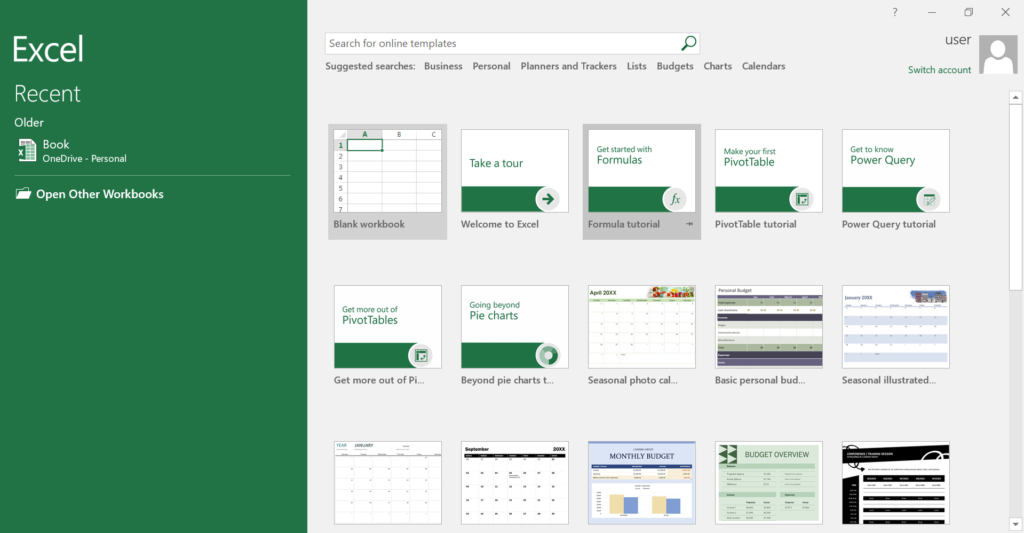
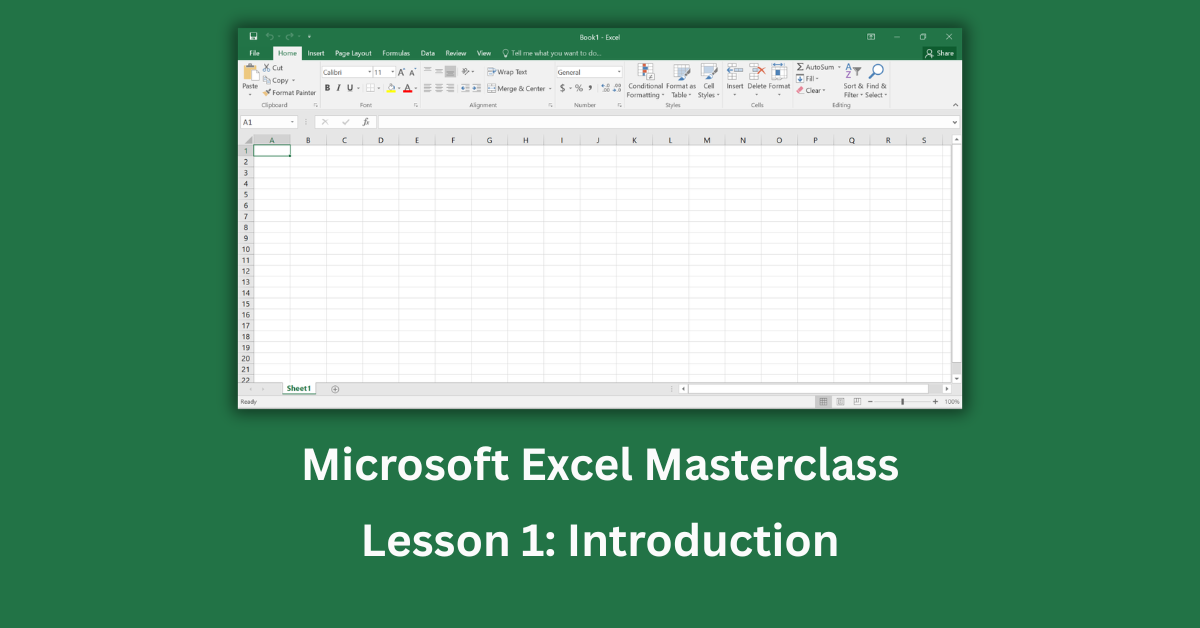
Excel is a spreadsheet application made by Microsoft. It organizes data into rows and columns inside a grid called a worksheet. You can store numbers, text, dates, and formulas in each cell. Multiple worksheets sit inside a single file called a workbook.
That description sounds simple. The reality is much more powerful.
Excel can perform thousands of calculations in seconds. It can create charts, run statistical analysis, connect to external databases, and automate repetitive tasks. In skilled hands, a single Excel file can replace what used to require dedicated software.
A Brief History Worth Knowing
Microsoft launched Excel for Mac in 1985, then Windows in 1987. It quickly beat Lotus 1-2-3 as the dominant spreadsheet tool — and it’s held that position for nearly four decades. The evolution of Excel reflects how data work itself has changed, from simple bookkeeping to complex business intelligence.
What Can You Actually Do With Excel?
This is where Excel gets interesting. Most people use maybe 10% of what the software can do. Here’s a broader picture.
Build and Manage Data
At its core, Excel is a database-lite. You can enter, sort, filter, and search data across thousands of rows. Pivot tables let you summarize large datasets without writing a single line of code. It’s genuinely useful for anyone who works with lists, records, or structured information.
Perform Calculations and Analysis
Excel’s formula system is extensive. Basic math functions like SUM and AVERAGE are just the beginning. Functions like VLOOKUP, INDEX/MATCH, and XLOOKUP help you pull information across tables. Statistical tools let you run regression analysis, calculate variance, or model probability distributions.
I’ve found that even learning 20-30 core formulas puts you ahead of most casual users. You don’t need to master everything — just the functions relevant to your work.
Create Charts and Dashboards
Visual communication matters. Excel makes it straightforward to turn raw numbers into bar charts, line graphs, scatter plots, and more. With a little formatting work, you can build dashboards that update automatically as underlying data changes.
Automate Repetitive Work
Excel supports macros — recorded sequences of actions you can replay with one click. For more control, it includes VBA (Visual Basic for Applications), a programming language built into the suite. Automating routine tasks like formatting reports or combining data files saves real time every week.
Work With AI Features in 2026
Microsoft has deeply integrated Copilot into Excel. As of 2026, Microsoft Copilot in Excel can generate formulas from plain English descriptions, summarize data, highlight trends, and suggest charts. You can type “show me which product had the highest return last quarter” and get an instant answer without touching a formula.
Who Uses Microsoft Excel?
The short answer: almost everyone in a professional setting. The longer answer is more interesting.
Finance and Accounting
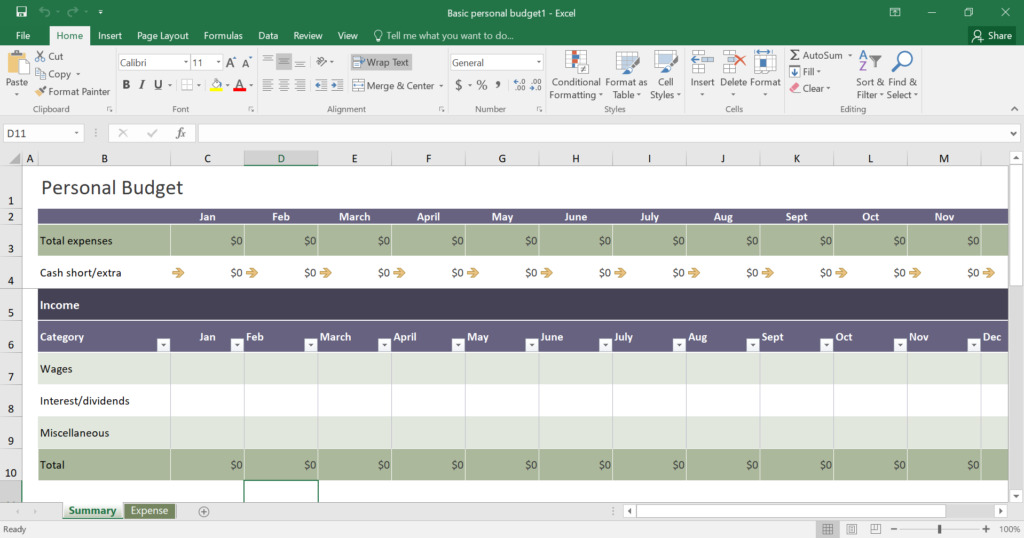
This is Excel’s traditional home. Financial analysts build models, accountants reconcile ledgers, and CFOs review budget reports — all in Excel. The software’s precision and auditability make it trusted in high-stakes environments.
Business Operations and Management
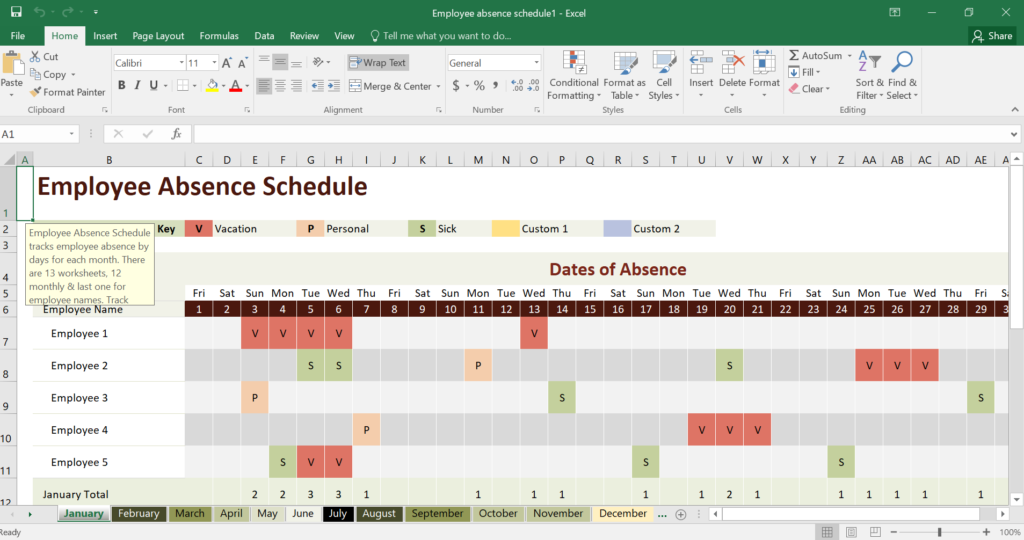
Project managers track timelines. Operations teams manage inventory. HR departments maintain employee records. Excel fits neatly into almost any workflow that involves structured data.
Marketing and Sales
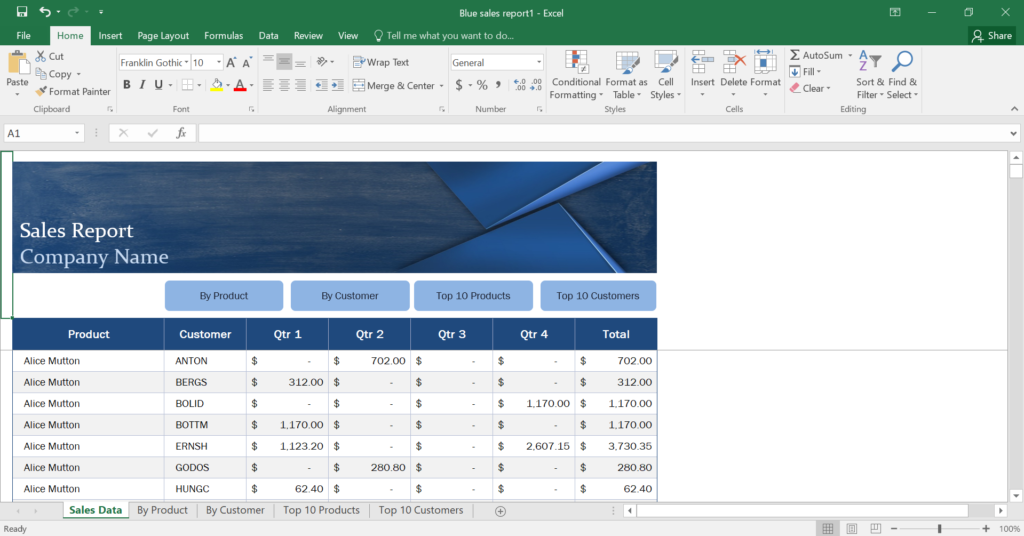
Campaign tracking, lead pipelines, conversion rate analysis — marketers use Excel constantly. It’s particularly useful when pulling data from multiple sources that don’t have a built-in reporting tool.
Small Business Owners
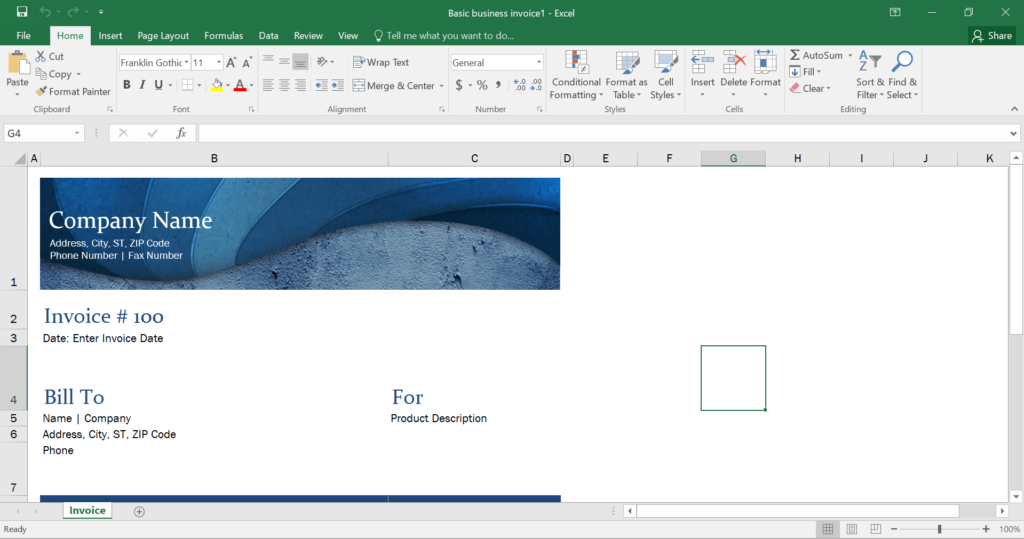
Many small businesses run entirely on Excel. Invoicing, expense tracking, cash flow forecasting — it handles all of it without the cost of dedicated accounting software.
Students and Educators
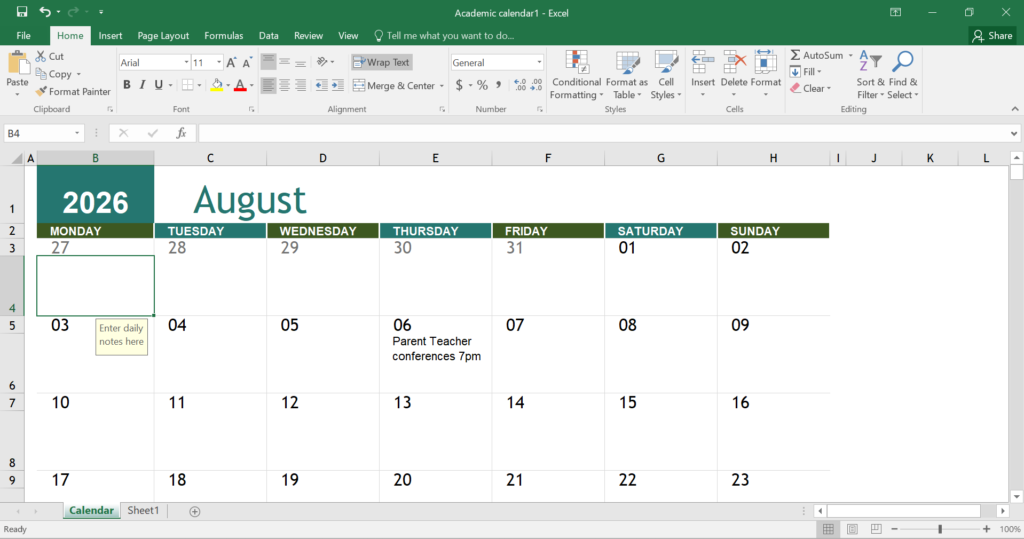
Learning Excel is a transferable skill that pays off fast. Many universities now include it in business, science, and social science curricula. Students who know Excel enter the job market with a real, immediate advantage.
Is Excel Still Worth Learning in 2026?
Fair question. Google Sheets is free and cloud-native. New AI tools promise to handle analysis automatically. Does Excel still matter?
Yes — and here’s why.
First, Excel remains the standard in corporate environments. Many organizations store years of institutional knowledge in Excel files. Knowing how to work with those files is non-negotiable in many roles.
Second, Excel’s power ceiling is far higher than alternatives. Google Sheets handles light-to-medium workloads well. But for large datasets, complex modeling, and advanced automation, Excel is still the stronger tool.
Third, the job market rewards Excel skills. Data from LinkedIn’s 2024 Workplace Learning Report shows spreadsheet tools consistently rank among the most in-demand technical skills across industries.
That said, Excel isn’t the right tool for everything. Real-time collaboration works better in Google Sheets. Complex databases belong in SQL. Serious data science lives in Python or R. Excel fits best when you need a powerful, flexible tool that most colleagues can open and understand.
How to Get Started With Microsoft Excel
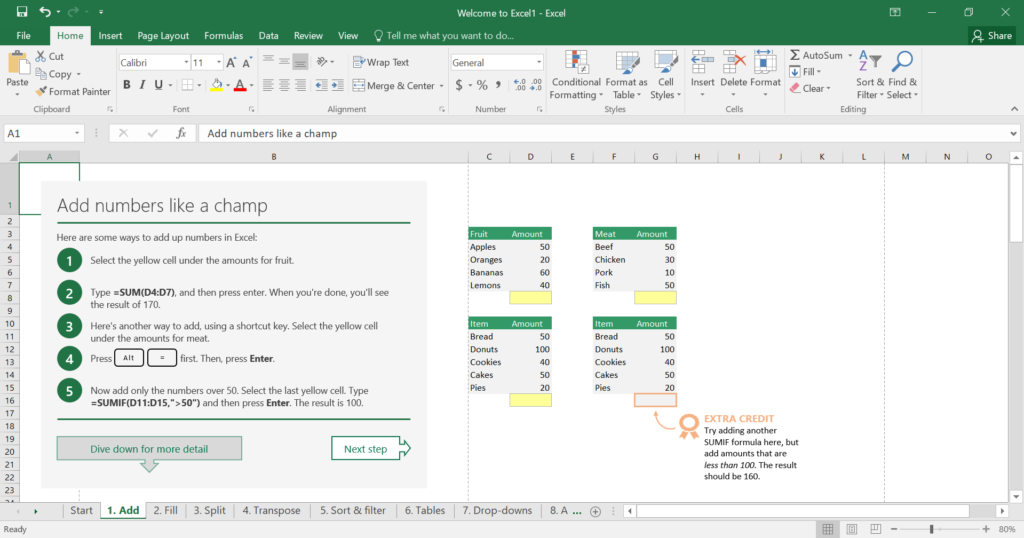
You don’t need a formal course to get productive. Here’s a realistic starting path.
Start by learning the interface — worksheets, cells, the formula bar, and basic navigation. Then pick up 10 essential formulas: SUM, AVERAGE, IF, VLOOKUP or XLOOKUP, COUNT, COUNTA, TEXT, LEFT/RIGHT, CONCATENATE, and IFERROR. These cover the majority of everyday use cases.
From there, learn to create a basic chart and a simple pivot table. Those two skills alone unlock most of what regular users need.
Microsoft’s free Excel training center offers solid beginner resources. YouTube also has excellent free tutorials — search for channels focused on Excel specifically rather than general Microsoft tutorials.
The Bottom Line
Microsoft Excel is 40 years old and shows no signs of slowing down. It’s grown from a basic number-crunching tool into a platform for data analysis, automation, visualization, and now AI-assisted decision-making. The 2026 version of Excel is the most capable it’s ever been.
If you’re not using it, you’re probably leaving efficiency on the table. If you’re already using it, there’s almost certainly more it can do for you.
The best place to start is with a real problem you actually need to solve. Open a new workbook, enter your data, and let curiosity take it from there.