Before you can write a single formula or build your first chart, you need to understand how Excel is actually structured. Not in a vague, hand-wavy way — but precisely enough that when someone says “look at cell D7” or “filter that column,” you know exactly what they mean and where to look.
Excel rows, columns, cells, and worksheets are the four building blocks of every spreadsheet that has ever existed. Get comfortable with these and everything else — formulas, pivot tables, data analysis — starts making sense much faster. Skip this step and you’ll spend the next six months confused about why things aren’t working.
This lesson walks through each concept clearly, with practical examples pulled from a real dataset so you can see how the theory connects to actual work.
Quick Takeaways:
- Every cell has a unique address made from its column letter and row number — like B4 or I27. Formulas use these addresses to calculate across your data.
- Rows run horizontally and hold one complete record — one transaction, one employee, one month of data.
- Columns run vertically and hold one type of information — all dates in one column, all amounts in another.
- A worksheet is a single tab in your workbook. One Excel file can hold dozens of worksheets, each with its own data.
- Cross-sheet formulas let worksheets talk to each other. A summary sheet can pull live calculations from a data sheet automatically.
Understanding Rows in Excel

Rows are the horizontal lines that stretch left to right across your spreadsheet. Excel identifies each row by a number, starting at 1 at the very top and running all the way down to 1,048,576.
That number isn’t a typo. Excel supports over one million rows per worksheet — which is more than most people will ever need. For context, a year’s worth of daily sales transactions for a mid-sized business fits comfortably within a few thousand rows.
What Goes in a Row
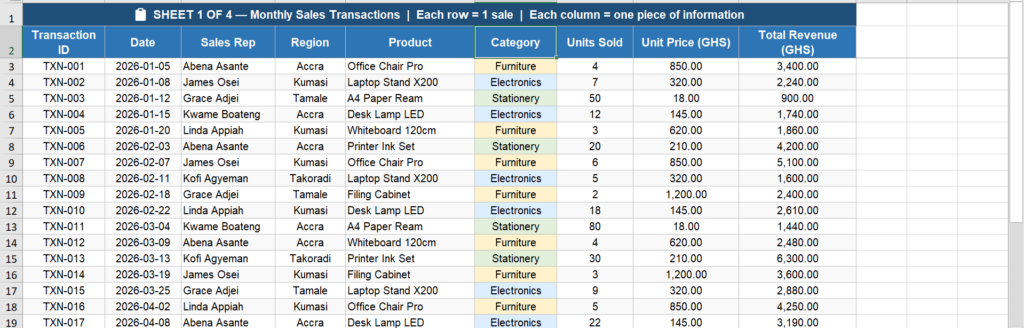
Think of each row as a single record. If you’re tracking sales transactions, row 3 holds everything about one sale: the date, the customer, the product, the amount. Row 4 holds everything about the next sale. Every column in that row describes some aspect of the same transaction.
This is the most important structural idea in spreadsheet design. One row equals one complete thing. When that discipline breaks down and people start mixing different types of records in the same rows, the data becomes impossible to filter, sort, or analyze cleanly.
Row Headers
The grey numbers on the far left of the screen are the row headers. Click any row header number and the entire row highlights. This is useful for selecting a full row to format it, delete it, or check its contents quickly.
Understanding Columns in Excel
Columns run vertically, from top to bottom. Excel labels them with letters: A, B, C… all the way to Z, then AA, AB, AC, and so on. There are 16,384 columns in every worksheet. You’ll rarely use more than a few dozen.
What Goes in a Column
Each column holds one type of information. Date in column B. Sales rep name in column C. Product name in column E. Revenue in column I. Every cell in that column contains the same kind of data, just for a different row.
This is what makes formulas possible. When every value in column G is a number representing units sold, you can write =SUM(G3:G26) and instantly add them all up. If different types of data are scattered across the same column, that formula breaks.
Column Headers and Naming
In most well-structured spreadsheets, row 1 or row 2 contains column headers — the labels that explain what’s in each column below. “Transaction ID,” “Date,” “Sales Rep,” “Total Revenue.” These aren’t just labels for human readers. Functions like VLOOKUP and structured table references use them to find the right column automatically.
According to Microsoft’s own guidance on structuring Excel data, keeping column headers in a single row and avoiding blank rows within your data are two of the most important habits for making Excel work correctly.
Understanding Cells in Excel
A cell is the individual box where a row and column intersect. Every cell has a unique address built from its column letter followed by its row number. Column B, row 3 becomes B3. Column I, row 27 becomes I27.
That address system is what makes Excel work. Formulas don’t say “multiply the units sold by the price.” They say “multiply G3 by H3.” Change the value in H3 and the formula recalculates automatically, because it’s reading from that specific address.
What a Cell Can Hold
Each cell can contain one of four things: a number, a piece of text, a date, or a formula. It can only hold one thing at a time. That sounds limiting, but it’s actually what keeps data clean and calculable.
A formula is the most powerful option. Type =H3*G3 in cell I3 and Excel multiplies whatever is in H3 by whatever is in G3 and shows the result. The cell displays the answer, but the formula bar above shows the actual formula. These are two different things, and knowing the difference matters when you’re debugging a calculation that’s returning the wrong answer.
Cell Ranges
A range is a group of cells selected together. Written as FirstCell:LastCell, like G3:G26. This tells Excel to include every cell from G3 down to G26 in whatever operation you’re running. =SUM(G3:G26) adds up all 24 values in that range without you having to reference each cell individually.
Ranges can span multiple columns too. A3:I26 refers to the entire block from the top-left cell A3 to the bottom-right cell I26 — every row and column in between is included.
Understanding Worksheets in Excel
A worksheet is a single tab inside an Excel workbook. When you open a new Excel file, you start with one worksheet. You can add more by clicking the plus icon at the bottom of the screen. Each worksheet has its own full grid of rows and columns, completely independent from the others.
Think of a workbook as a binder. Each worksheet is a page inside that binder. They’re all part of the same file, but each one holds different information.
When to Use Multiple Worksheets
Multiple worksheets solve a real problem: keeping different types of data separate without creating multiple files. A well-structured workbook might have one sheet for raw transaction data, another for a product catalogue, a third for a monthly summary, and a fourth as a reference guide.
Keeping raw data on one sheet and summary analysis on another is a professional habit that pays off quickly. It means your source data stays clean and untouched while you do calculations on a separate sheet. If something goes wrong with a formula, it doesn’t corrupt your original data.
Cross-Sheet Formulas
Here’s where worksheets become genuinely powerful. A formula on one sheet can reference cells from a completely different sheet in the same workbook. The syntax looks like this: =’Sheet Name’!CellAddress.
So a summary dashboard sheet could contain =SUM(‘Sales Transactions’!I3:I26) — and that formula reaches across to the Sales Transactions sheet, reads column I, adds up all the revenue, and displays the result. Change any value in the Sales Transactions sheet and the dashboard updates automatically.
I’ve found this particularly useful when building monthly reports. The raw data lives on one sheet. The report everyone reads lives on another. The numbers stay connected without anyone having to manually copy figures across.
Naming and Colour-Coding Worksheets
Default sheet names like Sheet1 and Sheet2 are useless. Rename every sheet to describe its contents: “Sales Data,” “Product List,” “Q1 Summary.” Right-click any tab to rename it, change its colour, or move it.
Colour-coding helps when you have several sheets. Blue tabs for raw data, green for reference tables, orange for summaries — this takes thirty seconds to set up and makes navigation much faster when you’re working quickly under pressure.
Putting It Together
Every Excel file you’ll ever open follows this same logic. A workbook contains worksheets. Each worksheet is a grid of columns and rows. Every row-column intersection is a cell with a unique address. Formulas connect cells together and can span across sheets.
Once you see the structure clearly, Excel stops feeling like a collection of random boxes and starts feeling like a system. A deliberate, logical one.
Your next step: open the practice file for this lesson and explore it by address. Click a cell, read its address in the Name Box, look at its content in the formula bar, and notice what type of data it holds. Do that for ten cells in different parts of the sheet. That exercise alone builds more intuition than reading about it ever could.