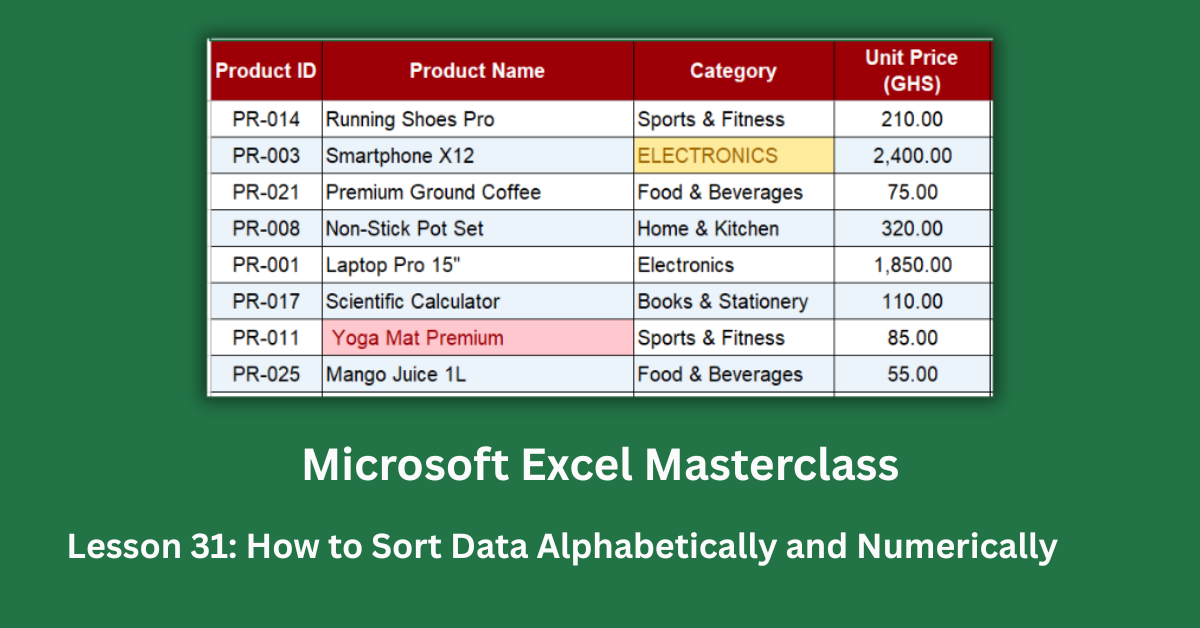
A 25-product inventory sheet with GHS 405,140 in total stock value tells a very different story depending on how it’s sorted. Sorted by price low to high, the Hardcover Notebook at GHS 28 sits at the top and the Smartphone X12 at GHS 2,400 anchors the bottom. Sorted by sales rank, the Smartphone — the best seller — appears first and the Mango Juice, slowest mover, closes the list. Same data, completely different insights.
Knowing how to sort data in Excel alphabetically and numerically is one of those skills that seems simple until the results come out wrong. The NexaStore product dataset behind this guide contains five embedded sort errors, all realistic and all invisible until you run a sort and the output surprises you. This post covers single-column sorts, multi-level sorts, and the specific mistakes that cause correct-looking data to sort incorrectly.
All sorting features covered here are available in Excel 2016 and all later versions, including Excel 2019, Excel 2021, and Microsoft 365. Multi-level sort, custom lists, and sort by colour all work in those versions. Excel for the web supports basic single-column sorts but has limited multi-level sort capability compared to the desktop app.
Quick Takeaways:
- Always click a single cell inside the data before sorting, not a whole column. Selecting column D and sorting only re-orders that column while every other column stays fixed, permanently misaligning your rows.
- Numbers stored as text sort as 1, 10, 11, 12… 2, 20… instead of 1, 2, 3. Check: real numbers right-align automatically. Text-numbers left-align and often show a green triangle.
- A blank row stops sort mid-table. Excel treats blank rows as table boundaries. Everything below the blank row stays in its original order, unaffected.
- Multi-level sort uses Data > Sort > Add Level. You can’t achieve the same result by sorting the same column twice — the second sort wipes out the first.
- Add a “Row ID” column before sorting. It’s the only way to restore your original row order if you sort and then change your mind after saving.
How to Sort Data in Excel: The Basics
Sort A to Z and Z to A (alphabetical)
Click any single cell in the column you want to sort. Go to Home > Sort & Filter and choose Sort A to Z for ascending or Sort Z to A for descending. Excel automatically detects the full data range and moves every column in each row together.
In the NexaStore dataset, sorting Product Name A to Z produces: Adjustable Dumbbells, Air Fryer XL, Assorted Herbal Tea… right through to Yoga Mat Premium at the end. Every row — price, stock quantity, supplier, status — moves with its correct product. Nothing gets separated.
The keyboard shortcut for opening the full Sort dialog is Alt + D + S or via Data > Sort. The dialog gives you more control than the one-click buttons, which matters once you move to multi-level sorting.
Sort smallest to largest and largest to smallest (numerical)
The same process applies for numbers. Click any cell in the Unit Price column, then choose Sort Smallest to Largest. The NexaStore inventory re-orders from GHS 28 (Notebook) at the top to GHS 2,400 (Smartphone X12) at the bottom.
That price spread — GHS 2,372 between the cheapest and most expensive product — is obvious only when you sort numerically. Unsorted, the Smartphone could appear anywhere in the 25 rows. One sort makes the range visible in seconds.
For the Data > Sort dialog, set Sort On to “Cell Values” and Order to “Smallest to Largest” or “Largest to Smallest.” This works for any numeric column: price, quantity, lead time, margin, or anything else stored as a real number.
Multi-Level Sort: Category First, Then Price Within
Single-column sorting is useful. Multi-level sorting is powerful. The NexaStore dataset has five categories — Books & Stationery, Electronics, Food & Beverages, Home & Kitchen, and Sports & Fitness — each with five products at different price points.
A multi-level sort by Category A-Z, then Unit Price Low-High within each category, groups the dataset into five clean sections. Within Books & Stationery, the Hardcover Notebook (GHS 28) appears first and the Desk Organiser (GHS 135) appears last. Within Electronics, the Bluetooth Speaker (GHS 145) sorts before the Smartphone X12 (GHS 2,400).
Applying a multi-level sort
Go to Data > Sort. Set your first level: Column C (Category), Order: A to Z. Then click Add Level. Set the second level: Column D (Unit Price), Order: Smallest to Largest. Click OK.
This is where people make the most common multi-level sort mistake: sorting by price first, then sorting by category separately. The second sort completely overwrites the row arrangement from the first. You can’t layer sorts one at a time. All levels must be set in the same Sort dialog, with level 1 as the primary sort key and level 2 (and beyond) as tiebreakers applied within each group.
Electronics stock alone is worth GHS 167,780 — the highest-value category in the dataset. After a multi-level sort, that entire category sits together, sorted by price, making stock management decisions much faster. Microsoft’s guide to sorting multiple columns covers every sort level option available in the dialog.
The Errors That Make Sorting Go Wrong
The NexaStore RAW sheet has five sort errors embedded in it. All five are realistic — the kind that arrive in imported data, shared files, or sheets built across multiple sessions by different people.
Numbers stored as text sort in the wrong order
PR-021 (Premium Ground Coffee) has Sales Rank stored as the text string “2” rather than the number 2. When you sort the Sales Rank column smallest to largest with text-numbers present, the result is: 1, 10, 11, 12, 13, 14, 15, 16, 17, 18, 19, 2, 20, 21, 22, 23, 24, 25, 3.
Premium Ground Coffee — the second best-selling product in the whole catalogue — appears in position 20 out of 25. Every buying and stocking decision based on that sort is wrong.
The fix is straightforward. Click a cell with a text-number and look for the green triangle in the top-left corner. Click the warning icon that appears and choose Convert to Number. Or select the entire column, go to Data > Text to Columns, and click Finish without changing any settings. Excel converts the column to real numbers in place.
To catch this before sorting: check alignment. Real numbers automatically right-align. Text-numbers sit on the left, just like regular text.
Dates stored as text sort alphabetically, not chronologically
Four reorder dates in the dataset (PR-002, PR-007, PR-015, PR-023) are stored as text strings in DD-MMM-YYYY format. A text sort of those dates puts “01-Feb-2024” before “10-Jan-2024” — because the sort compares character by character, and “0” comes before “1”. January (stored as “10-Jan”) sorts after April (“05-Apr”) because the digit “1” is greater than “0” at position 1.
The fastest fix: select the date column, go to Data > Text to Columns > Next > Next, select the Date (DMY) option, and click Finish. Excel converts the text strings into real date values. After that, any date sort produces correct chronological order.
A leading space puts a product in the wrong alphabetical position
PR-011 in the raw dataset has its product name stored as ” Yoga Mat Premium” with a single space at the start. In an alphabetical sort, the space character sorts before any letter. So ” Yoga Mat Premium” appears at the very top of an A-to-Z sort — above “Adjustable Dumbbells” — because space (ASCII 32) is lower than A (ASCII 65).
On screen, the leading space is invisible. You’d never spot it by reading the cell. The easiest detection method: =LEN(B11)=LEN(TRIM(B11)) returns FALSE if a cell has extra spaces. The fix is equally clean: a helper column with =TRIM(B11) removes all leading and trailing spaces. Copy the helper column, paste values back onto the original column, and delete the helper.
Mixed case creates phantom duplicate categories
PR-003 has its category stored as “ELECTRONICS” in all capitals. PR-020 is “books & stationery” in all lowercase. When the dataset is sorted by category for a multi-level sort, Excel’s default case-insensitive sort groups them together with the correctly-cased versions. But if the Case Sensitive option is ticked in Sort Options, or when COUNTIF and pivot tables are involved, “ELECTRONICS” and “Electronics” become two separate categories. Electronics products split into two groups. The category counts are wrong.
The fix is =PROPER(C3) in a helper column, which converts any case variant to Title Case. Copy, paste values, delete the helper. All 25 products then have consistent category names that group correctly under every analysis.
A blank row stops the sort at mid-table
The RAW sheet has a blank row between position 10 and position 12. Excel auto-detects your data range when you click a cell and start a sort. When it hits a completely blank row, it treats that as the end of the table. Only the 10 rows above the blank row get sorted. The 15 rows below stay in their original shuffled order.
The result looks almost right — the top section is sorted. The bottom section just seems unsorted by coincidence. This is one of those errors that passes a quick visual check. The fix: select the blank row, right-click, Delete Row, then re-sort.
Add a Row ID Before You Sort Anything
Before running your first sort on any dataset, insert a helper column and number the rows sequentially: 1, 2, 3… all the way down. Use Home > Fill > Series > Columns to fill it automatically.
After any sort, re-sorting by that Row ID column restores the exact original row order. This only works if you created the column before sorting and didn’t delete it. It costs about 30 seconds and has rescued many sorting sessions that went wrong after saving.
The NexaStore dataset’s 25 products span a GHS 2,372 price range and average 41.2% gross margin. Sorted by sales rank, the Smartphone X12 (Rank 1, GHS 2,400) leads a list where the Ballpoint Pen Box (Rank 20, 60% margin) quietly outperforms products ranked far above it on margin despite low sales volume. That kind of insight only becomes visible when the data is sorted correctly.For building on sorting with filters and structured tables that sort automatically, Microsoft’s guide to Excel Tables is a natural next step.