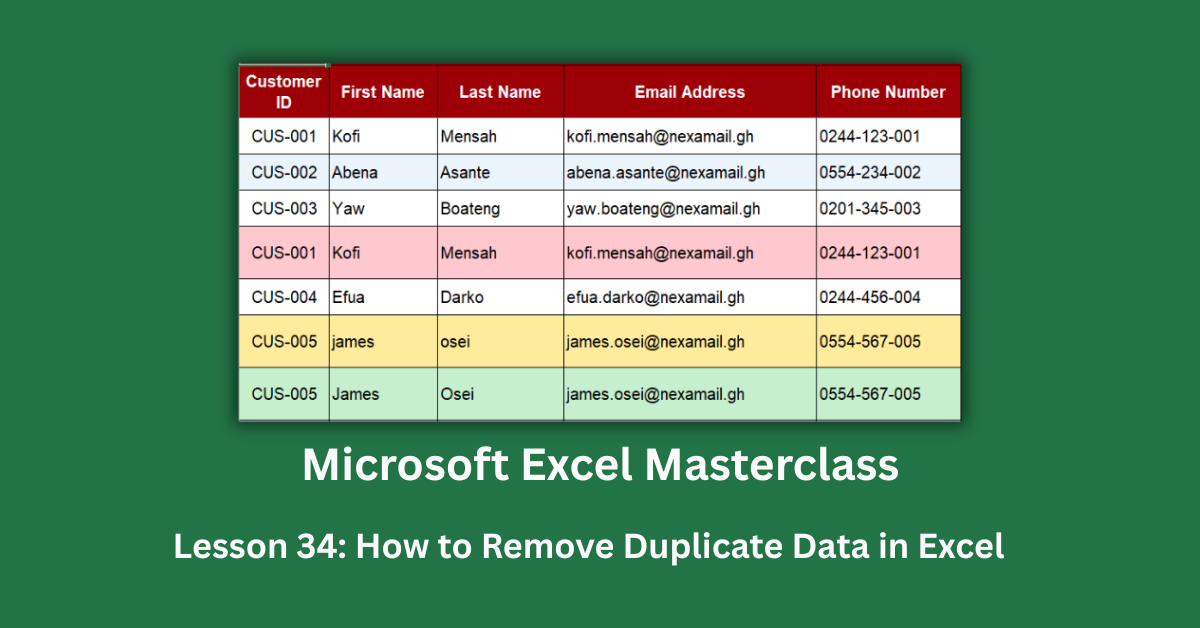
The NexaCorp customer database used throughout this guide has 32 rows and looks like it covers 32 customers. It doesn’t. After removing duplicates correctly, it contains 23 unique customers — meaning 9 rows, or 28% of the entire dataset, are duplicates. That’s a significant problem on its own. The more damaging consequence shows up in the totals: the raw dataset shows GHS 70,270 in cumulative customer spend. The actual figure, once duplicates are removed, is GHS 48,890. The difference, GHS 21,380, exists only because the same customers were counted multiple times.
Knowing how to remove duplicate data in Excel properly means more than clicking the Remove Duplicates button. The dataset contains five distinct types of duplicates — exact copies, case-different near-duplicates, trailing space near-duplicates, partial duplicates with conflicting field values, and phone number format variations. The built-in tool catches some of them. The others require a formula-first approach before any deletion happens.
These features are available in Excel 2016 and all later versions, including Excel 2019, Excel 2021, and Microsoft 365. The UNIQUE function (which extracts a list of distinct values non-destructively) is only available in Microsoft 365 and Excel 2021 — it is not available in Excel 2016 or standalone Excel 2019. All other methods described here work across every version.
Quick Takeaways:
- Remove Duplicates always keeps the first occurrence and deletes later ones. There is no preview. Save a backup copy before clicking OK.
- 28% of the NexaCorp customer database was duplicates. This inflated reported spend by GHS 21,380. Always audit before assuming your row count equals your customer count.
- COUNTIF flags duplicates without deleting anything — use it to review before removing. =COUNTIF($A:$A,A3)>1 marks any Customer ID appearing more than once.
- Trailing spaces and case differences defeat Remove Duplicates. Apply TRIM() and PROPER() to a helper column first, then deduplicate on the cleaned version.
- Never run Remove Duplicates on a transaction table. A customer appearing on 5 order rows is valid. Remove Duplicates on the name column would delete 4 of those orders silently.
How to Remove Duplicate Data in Excel: The Main Tool
Using Data > Remove Duplicates
Click any cell inside your data. Go to Data > Remove Duplicates. A dialog opens listing every column in your table with checkboxes. Select which columns Excel should use to define “duplicate” — two rows are duplicates if they match on every selected column.
Tick all columns to find rows where literally everything matches. Tick only Customer ID to find any row where that ID appears more than once, even if names or emails differ. Click OK. Excel tells you how many duplicates were removed and how many unique values remain.
In the NexaCorp dataset, running Remove Duplicates with all columns selected removes four rows: CUS-001 (Kofi Mensah, Gold, GHS 4,850), CUS-002 (Abena Asante, Silver, GHS 2,300), CUS-003 (Yaw Boateng, Bronze, GHS 780), and CUS-015 (Serwa Boadu, Gold, GHS 4,200). All four were submitted twice — identical in every column — leaving 28 rows remaining.
The critical thing Remove Duplicates doesn’t tell you
There’s no preview. No list of what was deleted, no way to see which specific rows were removed before they’re gone. Excel always keeps the first occurrence and silently deletes any later matching rows.
This matters because “first occurrence” doesn’t mean “most complete” or “most accurate.” If the more detailed record was entered second, it’s the one that disappears. Save a backup copy of the sheet — literally File > Save As — before running Remove Duplicates on any dataset you can’t afford to lose. Once you save after removing, Ctrl+Z can’t bring the deleted rows back.
For full documentation on every option in the Remove Duplicates dialog, Microsoft’s remove duplicates reference explains the column selection logic with examples.
The Duplicates Remove Duplicates Misses
Case-different near-duplicates
CUS-005 James Osei appears three times in the NexaCorp raw data. One version is “james osei” in all lowercase, imported from a legacy CSV. A second version is “JAMES Osei” in mixed caps, submitted via a referral form. The third is the correct “James Osei” entered through the website.
Remove Duplicates with all columns selected removes none of these. Because text case is included in the comparison, “james” and “James” and “JAMES” are treated as different values. All three rows survive. The dataset now has one legitimate entry and two phantom duplicates that look correct on screen.
The fix: add a helper column with =PROPER(B3)&PROPER(C3)&LOWER(D3) — combining a normalised version of name and email. Run COUNTIF on this helper column to find rows with matching normalised values. Review them, delete the wrong versions, then delete the helper column. Running Remove Duplicates after normalising will catch the remaining matches correctly.
Trailing space near-duplicates
CUS-006 Linda Appiah has a clean row and a near-duplicate with “Appiah ” (trailing space) in the Last Name field and “Accra ” (trailing space) in the City field. Visually, the two rows are indistinguishable. The space is invisible on screen, but it’s real to Excel. “Appiah” and “Appiah ” are different strings, so Remove Duplicates keeps both.
Detect these with =LEN(C3)<>LEN(TRIM(C3)) — this returns TRUE for any cell where a TRIM would change the length, meaning extra spaces exist. Or use =EXACT(C3,TRIM(C3)) — returns FALSE if spaces are present.
Fix by adding a helper column with =TRIM(B3) and running deduplication on the trimmed values. Alternatively, select the affected column and run Data > Text to Columns > Finish (no changes needed) — this strips leading and trailing spaces in place.
Partial duplicates: same ID, different field values
CUS-008 Samuel Quaye appears twice. Both rows have the same Customer ID, name, phone, city, date, tier, and spend. Only the email differs: one row has “samuel.quaye@nexamail.gh” and the other has “S.QUAYE@NEXAMAIL.GH”. Remove Duplicates on all columns keeps both rows. Remove Duplicates on Customer ID alone deletes one — but which email is correct?
This is where a simple tool can’t substitute for human judgment. Use =COUNTIF($A:$A,A3)>1 to flag rows where the Customer ID appears more than once. Filter to only flagged rows. Compare the two records manually. Decide which email is the master — in this case, the lowercase version — then delete the other row manually. Only then should you run Remove Duplicates as a final check.
I’ve found that partial duplicates are almost always created by data merging from multiple sources where one system uses a different format or convention from another. They require review, not automation.
COUNTIF: Audit Before You Delete
The safest deduplication workflow starts with COUNTIF, not Remove Duplicates. In a helper column next to your data, enter:
=COUNTIF($A:$A,A3)
This counts how many times the value in A3 (Customer ID) appears in the entire column A. A result of 1 means the ID is unique. A result of 2 or more means a duplicate exists. Filter the helper column to show only values greater than 1, and you’ll see every duplicate before anything is deleted.
For the NexaCorp dataset, this formula flags eight Customer IDs: CUS-001, CUS-002, CUS-003, CUS-005, CUS-006, CUS-008, CUS-015, and CUS-023. Reviewing those 15 flagged rows before removing anything reveals the five different duplicate types — which means different solutions for each.
For more on COUNTIF syntax and multi-column variations using COUNTIFS, Microsoft’s COUNTIF function reference covers every argument.
Conditional Formatting: Visual Duplicate Highlighting
Select the Customer ID column. Go to Home > Conditional Formatting > Highlight Cell Rules > Duplicate Values. Choose a highlight colour and click OK. Every Customer ID that appears more than once turns the colour you chose — including the original and all its duplicates.
This is a fast visual audit, not a deletion tool. It highlights every occurrence, not just the extras, so you can see the full picture before touching anything. In the NexaCorp dataset, eight Customer IDs highlight immediately: the four exact duplicate pairs, the three CUS-005 rows, and the two CUS-008 rows.
The limitation: it works on one column at a time and doesn’t tell you whether the duplicates are exact or near-exact. Use it as a first-pass scan, then follow up with COUNTIF on a composite key for more precision.
When NOT to Use Remove Duplicates
This is worth being direct about. Remove Duplicates is designed for entity master tables — lists of customers, products, employees where each entity should appear once. It is the wrong tool for transaction tables.
A sales orders table with CUS-008 Samuel Quaye appearing on five rows is not a duplicated database. It’s a customer who placed five orders. Running Remove Duplicates on the Customer ID column would delete four of those order rows. Samuel Quaye’s GHS 5,400 spend would suddenly look like one transaction. The revenue total drops without explanation.
Before running any deduplication, ask: should each unique entity in the key column appear exactly once? If yes — customer database, product catalogue, employee list — proceed carefully. If no — orders, transactions, events — do not use Remove Duplicates. Use COUNTIF to find only rows that are identical across every column, which would indicate accidental double-entry rather than legitimate repeat records.
For Microsoft 365 users who want a non-destructive alternative, the =UNIQUE() function extracts a distinct list from any range without touching the original data. Exceljet’s UNIQUE function guide explains the syntax and array behaviour clearly.
The Inflation Problem
Going back to the numbers: GHS 70,270 in reported spend versus GHS 48,890 in actual spend. That GHS 21,380 gap doesn’t represent revenue that was lost. It represents revenue that never existed — inflated by counting the same Gold-tier customers twice or three times in the total.
The six Gold-tier customers in the clean database average GHS 4,942 each. The eight Bronze-tier customers average GHS 499 each. Those averages, used for segment strategy, loyalty programme design, or forecasting, are only meaningful if the underlying customer count is accurate. A 28% duplication rate makes every per-customer metric wrong by a significant margin.
Clean the data before analysing it. Audit with COUNTIF first. Fix near-duplicates with TRIM and PROPER before running Remove Duplicates. Keep a backup before any deletion. And know whether you’re working with an entity table or a transaction table before you touch a single row.